Go to Reporting > Sales > Sales Graphs from the left hand menu or click on the Sales Graphs link under Reporting on the home page.
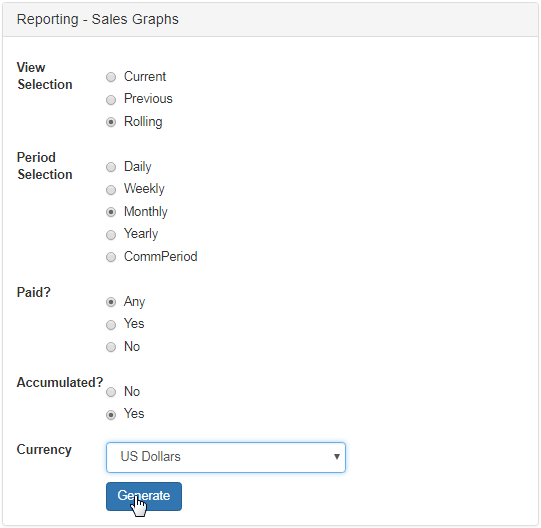
This is where you can view your sales progress in a graphical representation. You will be displayed with a list of options which can be selected that will generate a graph below showing the relevant information. Select the option button for each attribute, choose a currency type and then click Generate.
- View Selection: Current, previous and rolling. A Rolling graph refers to a moving average that changes frequently.
- Period Selection: Select the time period for for the sales on the graph, i.e. monthly, weekly, etc.
- Paid? This is the option for the graph to display all orders, and indicates only the paid orders or the unpaid paid orders.
- Accumulated? Select Yes if you want to display the accumulated value of all the sales on the graph.
- Currency: Indicates the currency you want the graph to display the sales in. Select your option from the drop-down list.
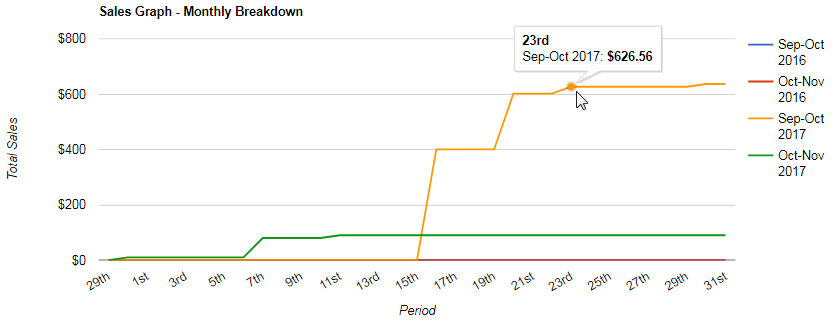
The system would then collect the information and generate the graph below based on your chosen criteria. The graph represent the Total Sales for the commission Period. Place the mouse pointer anywhere on the graph lines to view the specific details. Here's a sample graph.