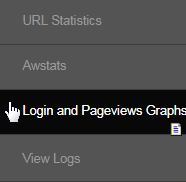
Go to Reporting > Misc > Login and Pageviews Graphs from the left hand menu or click on the same link under the Reporting on the home page.

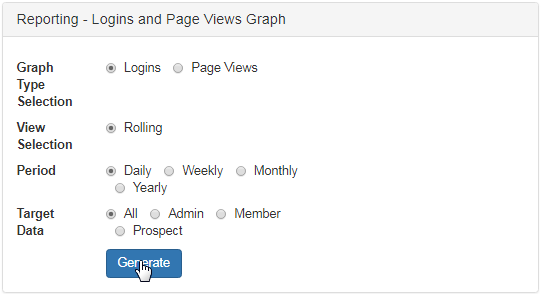
This report provides the graphical representation depicting the volume of the user login and pages viewed for your website for a given period of time. Simply set the preferences for which you want to display the graph report and then click on the Generate button. Here's the description of the filters;
- Graph Type Selection: Select the type of event (as described below) to be used in the graph. Click on the preceding radio-button to choose.
- Login: The option to generate the graph with respect to the volume of successful logins into the system in the specified period of time.
- Page View: The option to generate the graph with respect to the volume of pages of the website viewed in the specified period of time.
- View Selection: The option to set the flow of the graph, i.e. by turning over the axis, show only the current data or only the previous data.
- Period: The frequency of the time period to be used in the graph, i.e. Daily, Weekly, Monthly or Yearly. Period is the X-axis of the graph and the frequency is broken down based on the respective unit of the option selected. which Click on the preceding radio-button to choose your option.
- Target Data: The type of user group for which the graph (login graph type) would be generated, i.e. Admin, Member, Prospect or All the user types.

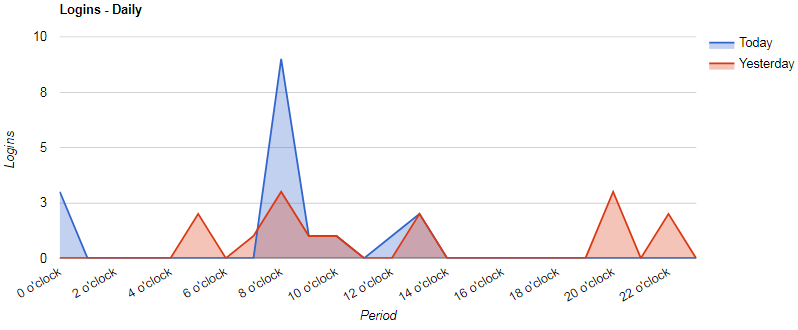
The graph (initially displays with default values) below will be refreshed with the matching data. . Graph type being the Y-axis and Period being the X-axis.

