Go to Reporting > Misc > Awstats from the left hand menu or click on the Awstats link under Reporting on the home page.
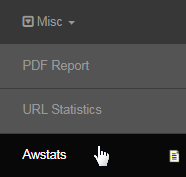
In the system, Awstats represents the Advanced Web Statistics which reports the details of site usage. The page will open up in a new browser tab. The report is displayed by month. Select the month and the year for which you want the report to be displayed and then click on the OK button next to it.
- Last Update: Displays the date and time when the information was last updated or when the statistics were last collected by the system.
- This does not affect the past statistics. It simply details the date up to which the statistics exist. Click on the Update now link to update the data.
- Reported period: You can select the time period to be used in the report from the drop-down list by the month and year, respectively.

The detailed report will be displayed on the screen in a tabular format broken down into various sections, such as monthly, weekly, daily, hourly, types of visitors, duration and many more. Starting with the Summary of the report, the common attributes explaining the report are as follows;
- Unique visitors: The number of different IP addresses that visited the site. Visitors are tracked by the IP address of the computer the person is using. If the same person returns to view your site within the month, that will add to the hits and pages, but won't increase the number of unique visitors.
- Number of visits: The number of times the site (1 or more pages) is viewed by a person. If someone visits your site and looks at 5 different pages, that counts as a single visit. If the person returns the next day and views more pages, that's a second visit. Below is the visits per visitor ratio.
- Pages: The number of different HTML pages or scripts in the website that have been accessed or looked at by the visitors (unique IP address). A page is a hit that is not an image, JavaScript or a CSS file and which was not loaded by a search engine robot. Below is the pages per visit ratio.
- Hits: The number of instances that the site was being accessed by a person, a search engine, an RSS reader, or any other source. A hit is counted each time someone views a file on your website. A single Web page can be made up of many files. Below is the hits by number of visits ratio.
- Bandwidth: The amount/size of data transferred when the visitors looked at your website. Below is the data transferred by number of visits ratio.

- Hits are recorded when requests are made to the server (e.g. image loading) and are not a reflection of how many users have connected.
- The system triggers the function for automatic collection of the information from the database daily at 1 p.m, during housekeeping.
- This needs to be checked and set up correctly in order for the statistics to be properly collected. Contact INS Support for any queries on this.
Below the summary are the classified reports which presents you with website usage information based on different factors as described in the following;
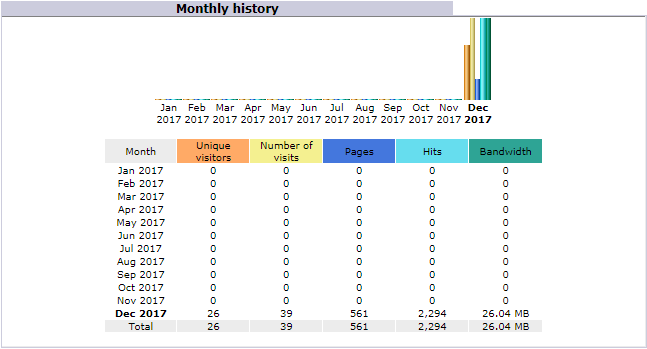
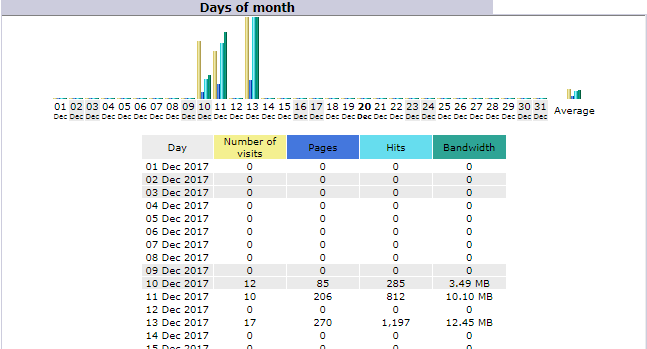
- Monthly history: Statistics of data usage as recorded per month. | Days of month: Data usage as recorded in each day of the month specified.
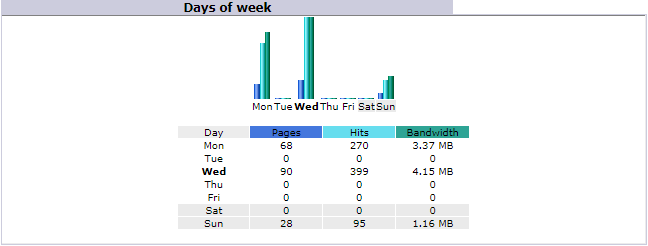
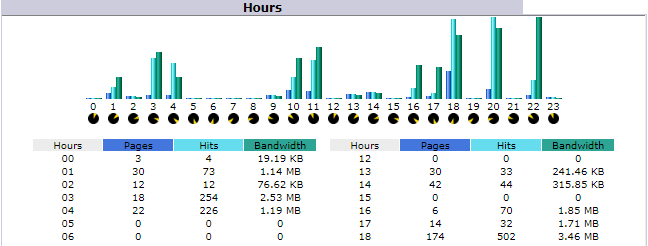
- Days of week: Data usage as recorded in each day of the last updated week. | Hours: Data usage as recorded every hour of the last updated day.
- Visitors domains/countries: Data usage by country name as identified by the domain name. This report shows the top 10 countries and their name with the highest number of hits. To view the complete list of the data by countries, click on the Full list link at the top right corner of the table.
- The countries shown by the statistics program are calculated by determining which ISP a visitor is using, then checking the country of that ISP.

- Hosts: Report on tracking website data usage by hosts name - it is an operating system file (plain text file) that maps hostnames to IP addresses.
- Just below the table headline, you will notice the number of known and unknown (unresolved) hosts and unique visitors displayed.
- This report shows the top 10 records with highest number of hits. To view the complete list, click on the Full list link at the top of the table.
- Last visit: Clicking on this link would bring up the full list of the available hosts records arranged in a newer-to-older date and time format.
- Unresolved IP Address: Clicking on this would bring up the list of available hosts records for which the IP address cannot be mapped.
- While inside the Full List or Last visit page, you can further narrow the search result by using the Filter and/or Exclude filter function.

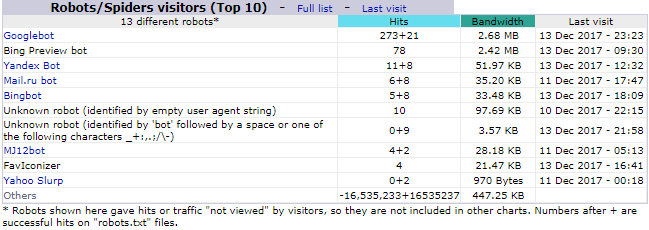
- Robots/Spiders visitors: Robots and Spiders are computers that examine the content of your website, rather than human viewers. For e.g. when Google examines your site to index the content, that will be shown as a robot or spider. Click on the available robot links to learn more about them.
- This report shows the top 10 records with highest number of hits. To view the complete list, click on the Full list link at the top of the table.
- Last visit: Clicking on this link would bring up the full list of the available hosts records arranged in a newer-to-older date and time format.
- Visits duration: This is a report on the Number of visits based on how much time a visitor had spent. The Average duration is shown above.
- File type: This report displays the hit percentage of the file types in your website and the data transferred volume subjected to the file types.


- Downloads: This is the report on the files as PDF, ZIP, etc that were downloaded by the visitors. The hits are counted as the number of times the download links were clicked. Also shows the bandwidth subjected to the downloads. To see the complete list, click on the Full List link at the top.
- Pages: This report highlights which pages in your site were viewed and by how many times. The URL of the pages will be listed in a descending order of Viewed. To see the complete list, click on the Full List link at the top. A counter keeps track of the Entry and the Exit times of a page.


- Operating Systems: Through this statistics you get to know from which OS type your website is being viewed, the number of pages that were viewed and the number of hits counted. Click on the Full List/Versions to see the report on the different versions of the respective OS type.
- Browsers: Through this statistics you get to know from which web browser your website is being viewed, the number of pages that were viewed and the number of hits counted. Click on the Full List/Versions to see the report on the different versions of the respective browser.


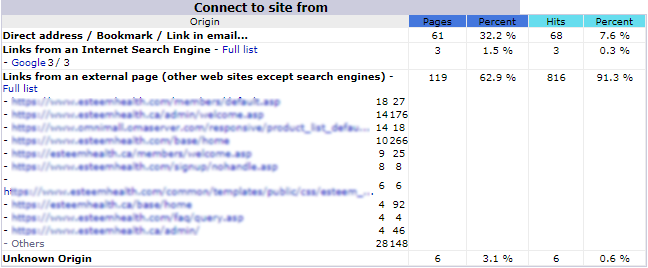
- Connect to site from: This report tracks (counts the pages and hits) the origin or the source of the connection to your website, i.e. the links/pages that leads the visitors to your website. The source can be direct access (your website URL), emails, bookmarks, search engine, external links, etc.
- Search Keyphrases: This table reports on how many times a page/content/function in the website is searched by using a certain key-phrase.
- Search Keywords: This table reports on how many times a page/content/function in the website is searched by using a certain key-words.
- Miscellaneous: Usage statistics of various sundry items (not important enough to be mentioned individually) that were recorded by the system.

- HTTP Status codes: The response status codes indicate whether a specific HTTP request has been successfully completed. Responses are grouped in five classes: informational responses, successful responses, redirects, client errors, and servers errors. This reports tracks the number of hits for the status codes. You can find several articles on internet that explains the HTTP Status codes. For e.g. Status Code Definitions.

